
Collection Gems: May 2020

Authored by: John Allen, johninretirement@gmail.com
Map 4 in the Society’s Map Collection is an 1850 map of New Jersey (title block in Figure 1). It is an update of the 1828 Gordon map of New Jersey, a featured Collection Gem (Map 8 in the Collection) in March/April 2017. So what’s changed in the intervening 170 years? Much!
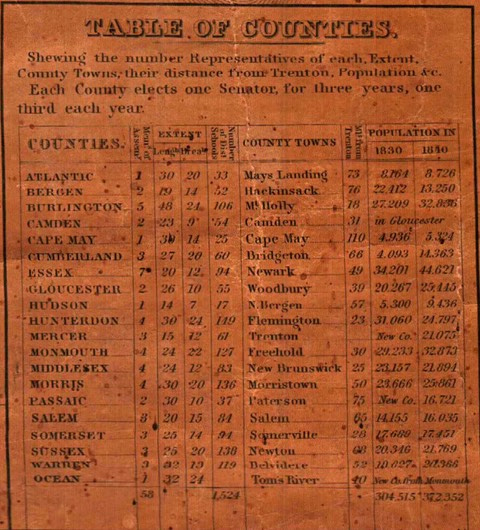
First, County statistics (Figure 2) show Hunterdon County (represented by its County seat of Flemington) lost 20% of its population between 1830 to 1840.
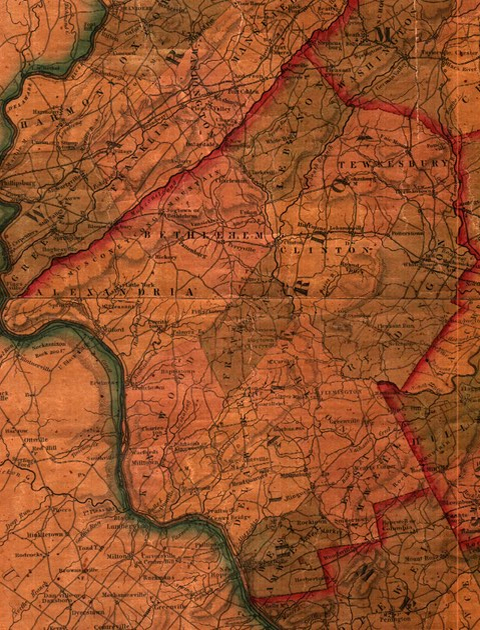
These data are from the 1830 and 1840 Federal census, so this “reduction” reflects the formation of Mercer County on 22 February 1838. The new county incorporated portions of Hopewell Township, and all of Lawrence and Ewing Townships and Trenton City. The resulting Hunterdon County is identical in shape to the one we know today (Figure 3). However, closer inspection reveals many differences, too. For example, the 1850 municipalities do not include the townships of Holland (1874) or Lebanon (1926), or the boroughs of High Bridge (1871) and Califon (1918).
An even closer look will reveal the familiar names we know today were often different in 1850.
- Sourland Mountain is labeled Rock Mountain.
-
Neshanic River was known as Nachanic Creek.
-
West Portal was also known as Jugtown; Cherryville as Dogtown; Glen Gardner as Clarksville; Stockton as
-
Center Bridge; Linvale as New Market; Kingwood as Johnson’s. There was no High Bridge since the railroad bridge was yet to be built.
Behind several of the name changes was the establishment of a more formalized postal system. In many cases the surname of the first post master became the established name for the population center, despite the Federal Government 1840 direction that “The name of the candidate for postmaster should not be applied as the name of a post office. It is preferable to have some LOCAL or PERMANENT name, which must not be the name of any other office in the State…”. Earlier towns were often named after a prominent landmark (often a tavern or hostelry).
As on the 1828 Gordon map, churches and their denomination are shown, as are important industrial sites (mills, manufactories, mines, glass works, forges and furnaces).
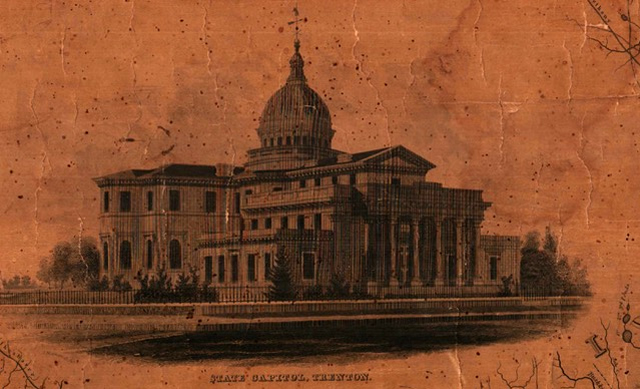
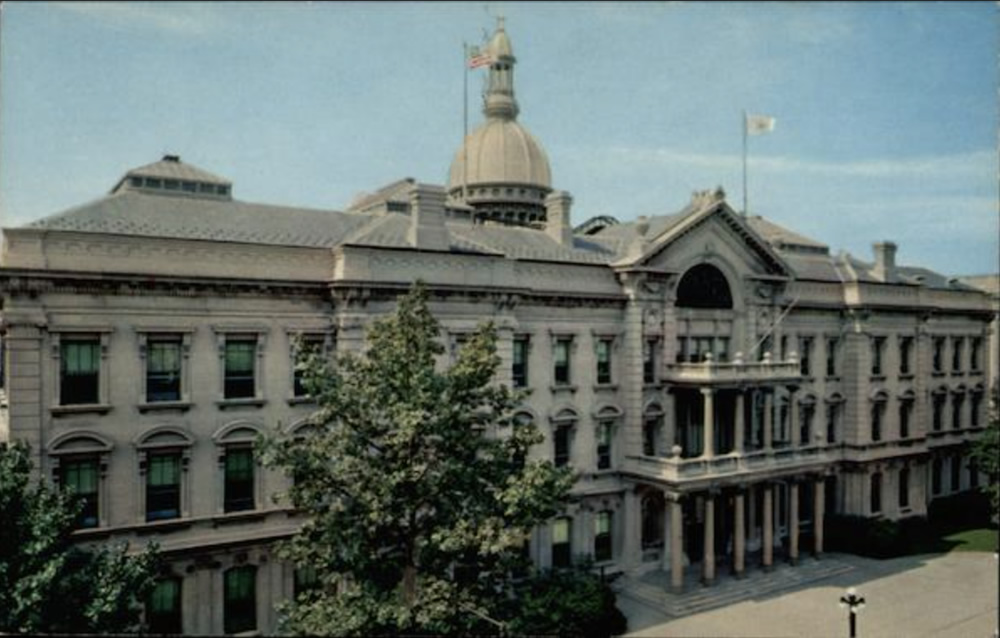
Note the “copper mines” west of Flemington. Discovered in 1834, these mines first produced ore in 1852, although never in paying quantities. Their existence is preserved today as Mine Street, Mine Creek and the Copper Mine Apartments in Flemington. The north County iron mines made New Jersey a leading iron producer for much of the 18th and 19th centuries. Figures 4 and 5 show the changes in Trenton’s State House. Built in 1790, this is the third oldest state house in continuous legislative use in the country.
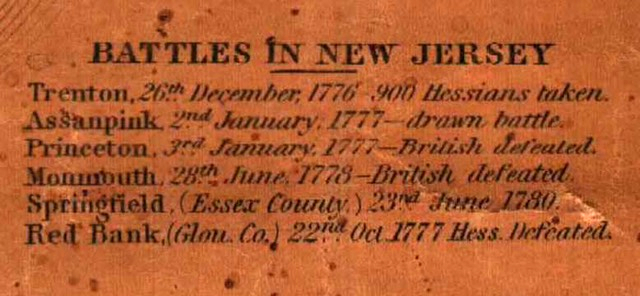
The former figure is a representation of the State House in the map’s marginalia. Compare it to a photo of the current State House (taken after its 1987 renovation was completed, but before the current restoration began). And New Jersey’s role in the American Revolution were the glory of the State, if not the country (Figure 6). Later wars were not widely popular, and the American Civil War was in the future, so the country took justifiable pride in its Revolution.
There is plenty to make one “Jersey Proud”, and the State’s role in American history is well represented in Map 4!