
Collection Gem: May 2018
Note: All figures in the article were lightened on my computer to improve legibility. The original map is darker due to the aging of glue used to affix the map to cloth backing.
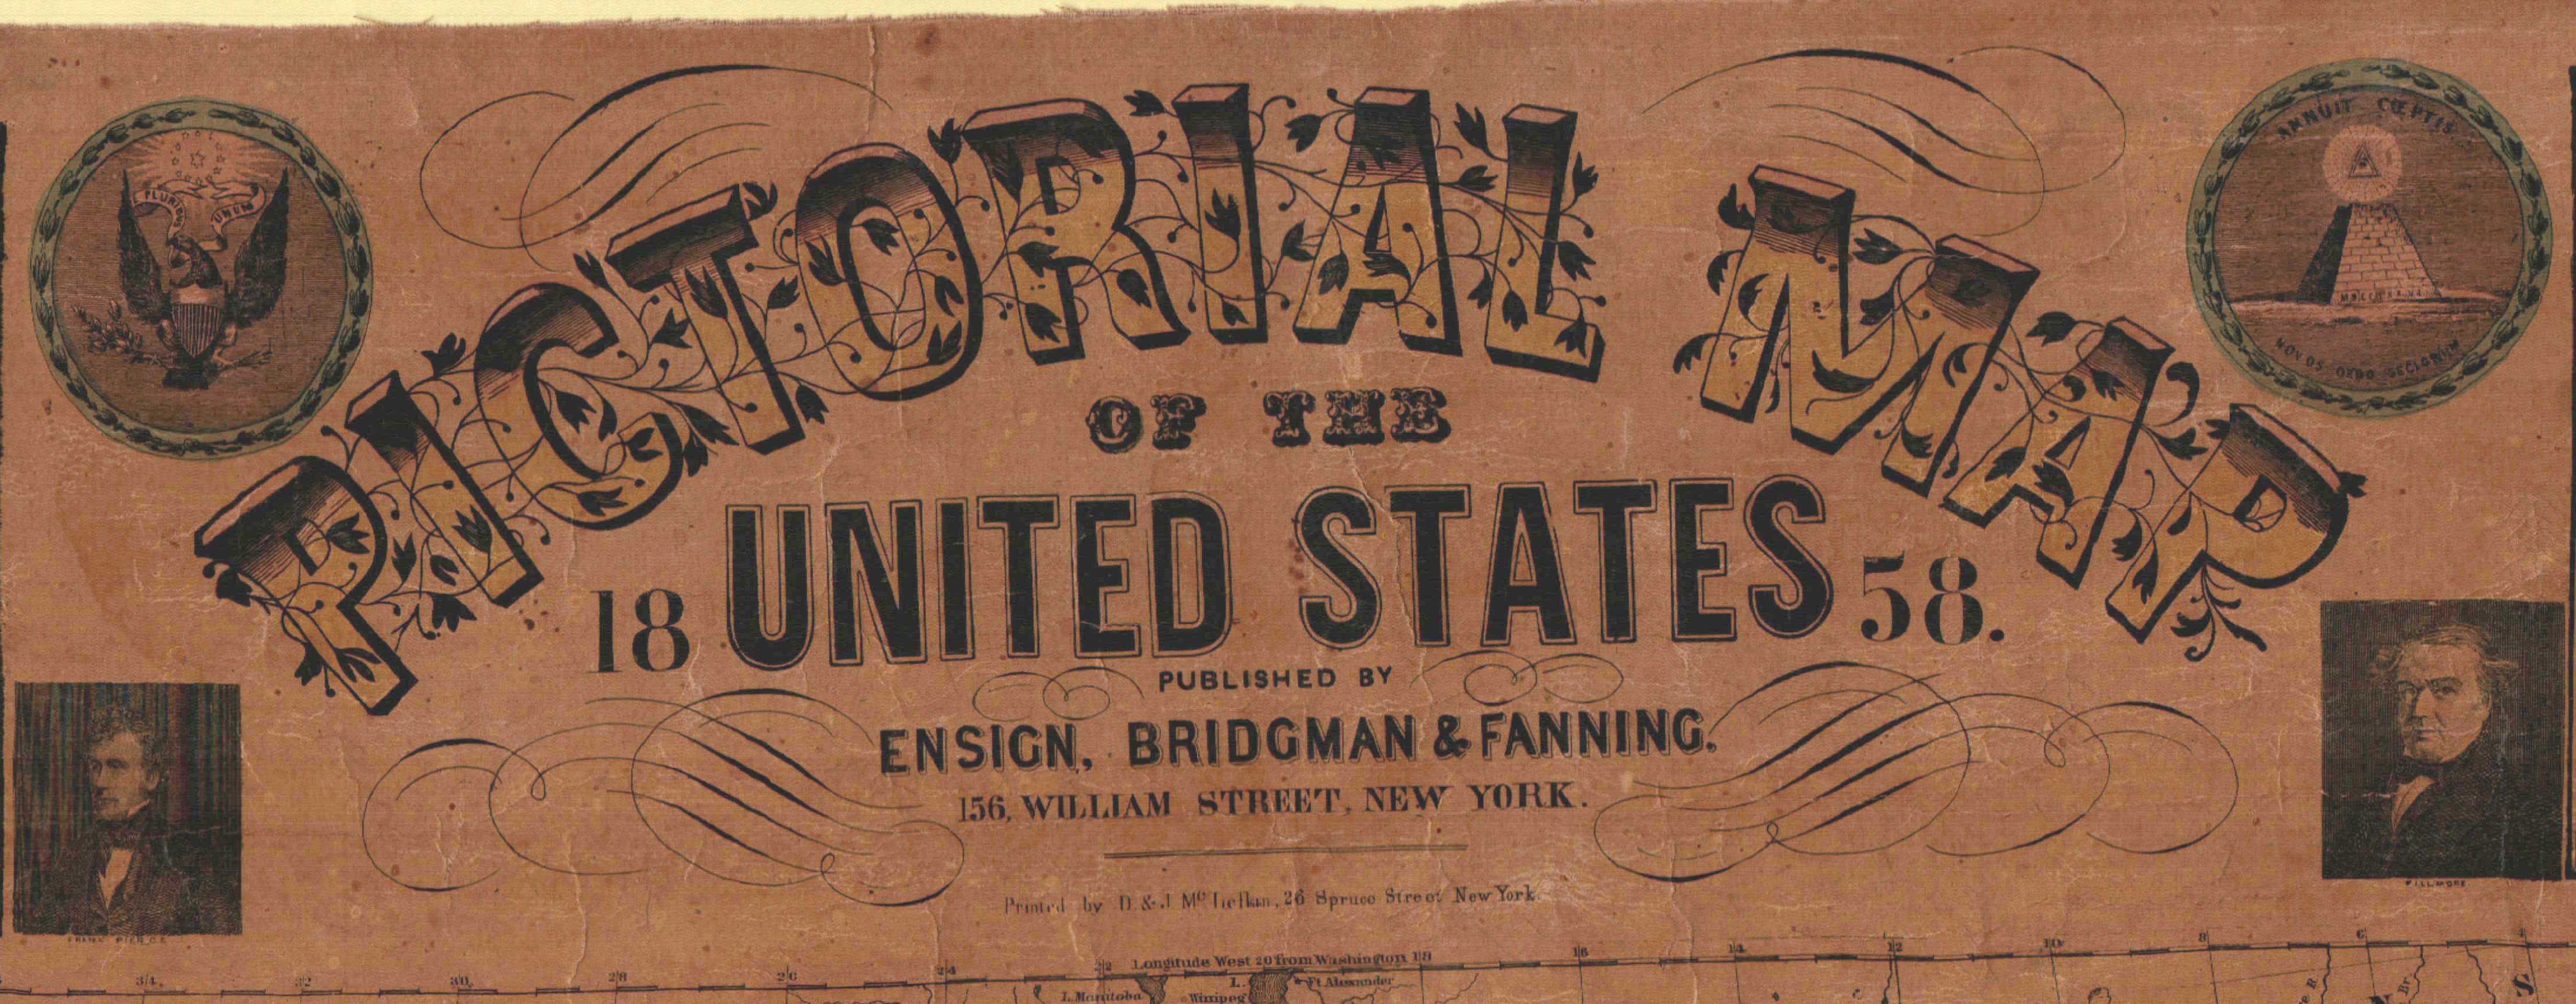
Map 93 is an 1858 map of the United States of America. The title (Figure 1) includes portraits of the two most recent Presidents, Millard Fillmore (July 9, 1850 – March 4, 1853) and Frank(lin) Pearce (March 4, 1853 – March 4, 1857). The President when the map was published was James Buchanan – March 4, 1857 to March 4, 1861 – who is consistently ranked as our worst President ever… Still a predominantly agrarian country, the map marginalia includes a tableau of agricultural implements (Figure 2) and images of key moments in American history (the signing of the Declaration of Independence, naval victories of the USS Constitution, and the War with Mexico, for example).
|
|
|
|


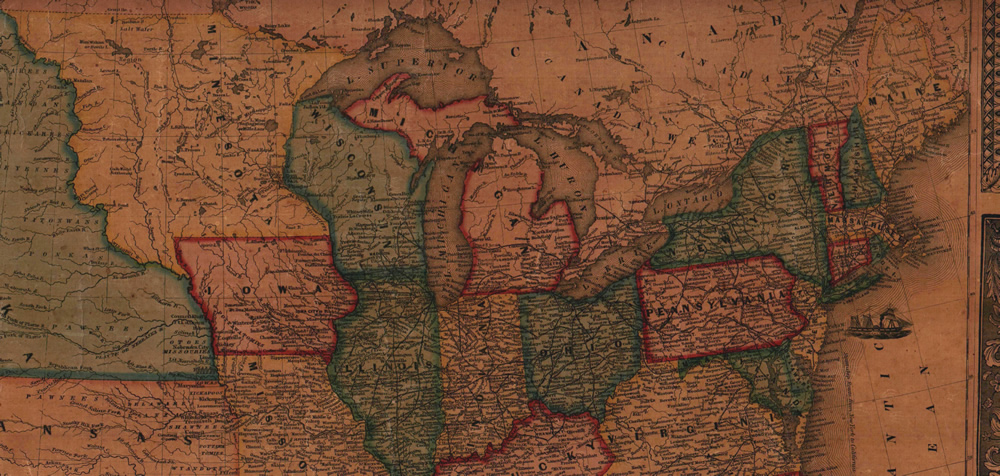
Notice in Figure 3 that Virginia was significantly larger in 1858 than it is now, containing – as it did until 1863 – what is now West Virginia. Noteworthy, too, is the preponderance of railroad mileage in northern states compared to southern ones. This benefited the North during the American Civil War which commenced only three years after the map was published. A quick look suggests there may have been more railroad mileage in the state of Ohio than in all the southern states combined, reflecting the importance of the “Western Reserve” as a source of farm produce and coal (which became the preferred fuel in cities, replacing wood by about 1850). Railroads stretched to new coalfields in Maryland, Ohio, and Illinois, whose production was used in the early foundries of Philadelphia, New York, Newark and Allentown. Most major railroads in the East (the Reading Railroad, Lehigh & Erie, Central Railroad of New Jersey, Pennsylvania Railroad and Delaware and Hudson Railroad) extended lines into these areas, beginning as mining company “shortline” railroads. These extended lines are seen on the map.
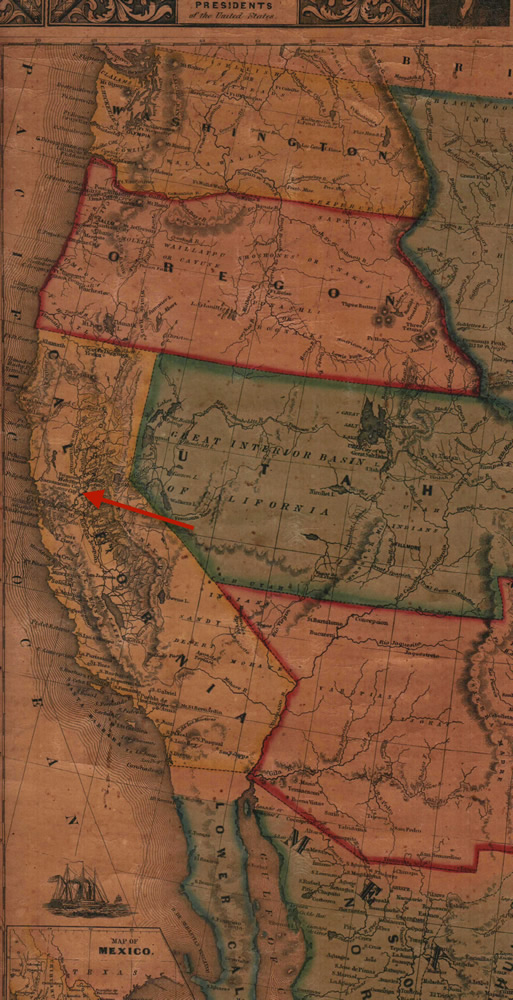
In the West, California was the only state on the Pacific Coast (Figure 4), almost 1,300 miles distant from the other 30 States. A cross-country railroad wasn’t available until the “Trans-Pacific Railroad” opened for business on May 10, 1869 after 6 years of construction. California was “a long way from anywhere” until then! Why institute a State so far from the rest of the Country? In a word: “GOLD” and the wealth it brought to the United States! The ’49 Gold Rush resulted in a substantial population by 1853 (a minimum of 60,000 residents were required for Statehood). No census was taken in California in 1850, but the first state census counted the population at 92,597. (Compared to the “estimated 200,000” shown on the map in Figure 3). The protracted political negotiations required to grant California statehood were followed by an almost 8 year hiatus in adding other states, after which Minnesota entered the Union on May 11, 1858. The map was presumably published prior to May 11 since Minnesota is mapped as the Minnesota Territory, extending westward to the Missouri River (Figure 5).
Here’s an interesting aside and our local connection: “Sutter’s City” (arrow in Figure 4) is NOT where Hopewell Township (Hunterdon County at the time) native James Wilson Marshall discovered gold in 1848. But it was named after the same man who owned “Sutter’s Mill”, the site of the discovery. John Sutter developed the area prior to his retirement in 1849 hoping the town would become the county seat. (He retired at age 39 as a result of gold discoveries at his Mill in the southern California Republic). However the railroad bypassed Sutter City and led to the creation of Sacramento, which became the State capital when Statehood was granted in record time on September 9, 1850. California entered the Union as a “Free State”, a complicated process resulting in the Compromise of 1850 which banned the slave trade (but not slavery) in the District of Columbia, and created a much stronger Fugitive Slave Act.